Plotting
# S3 method for ben_results
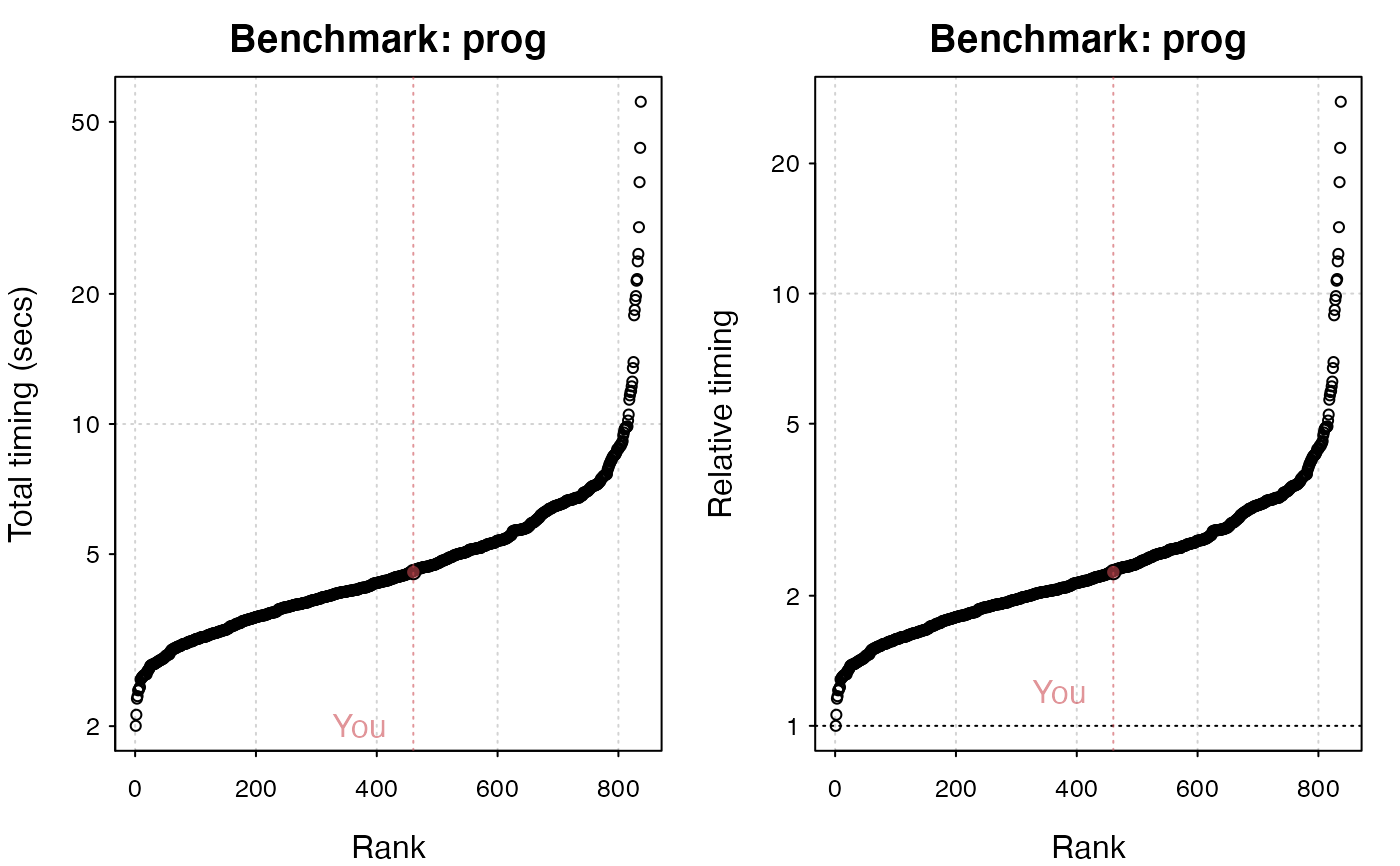
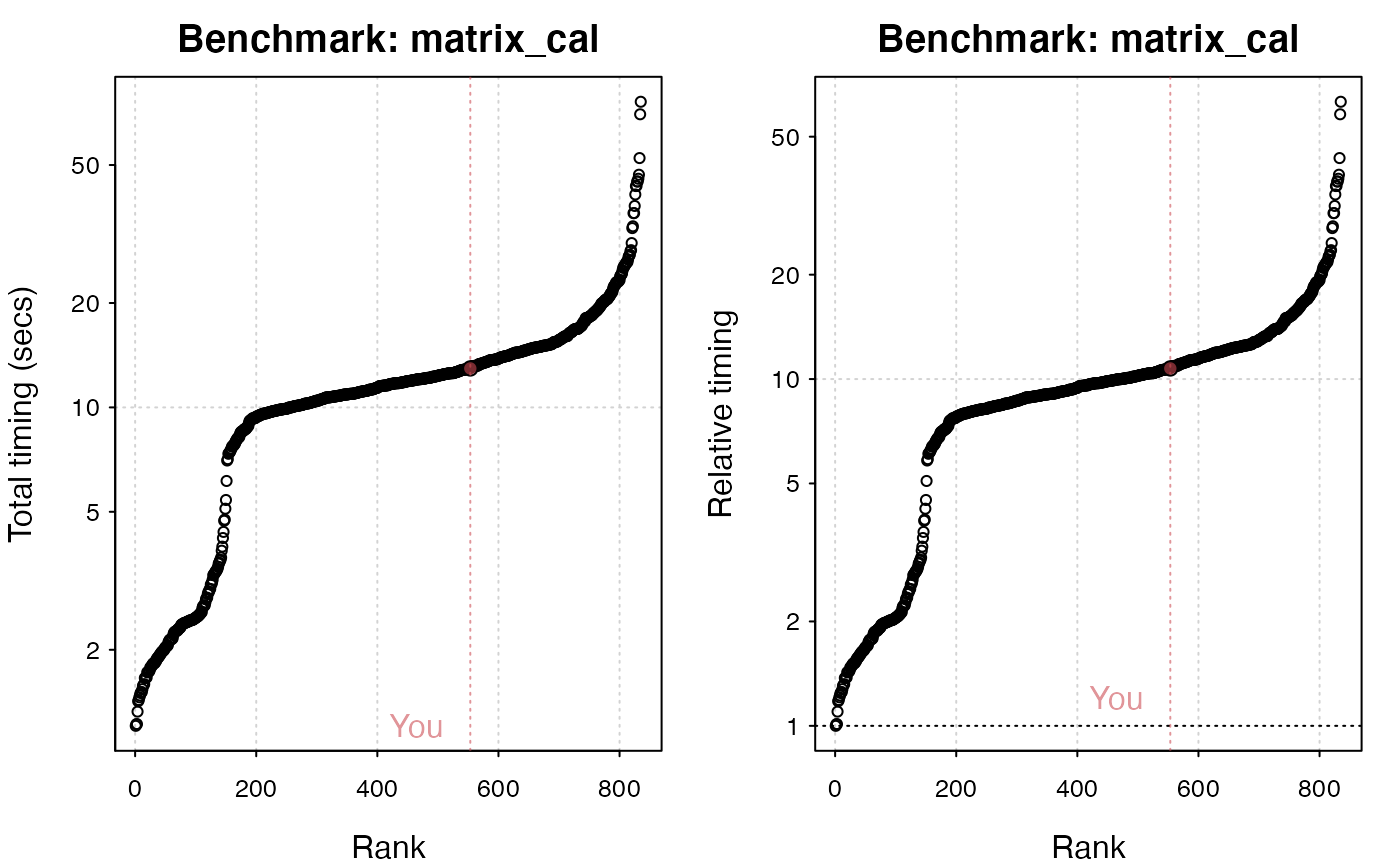
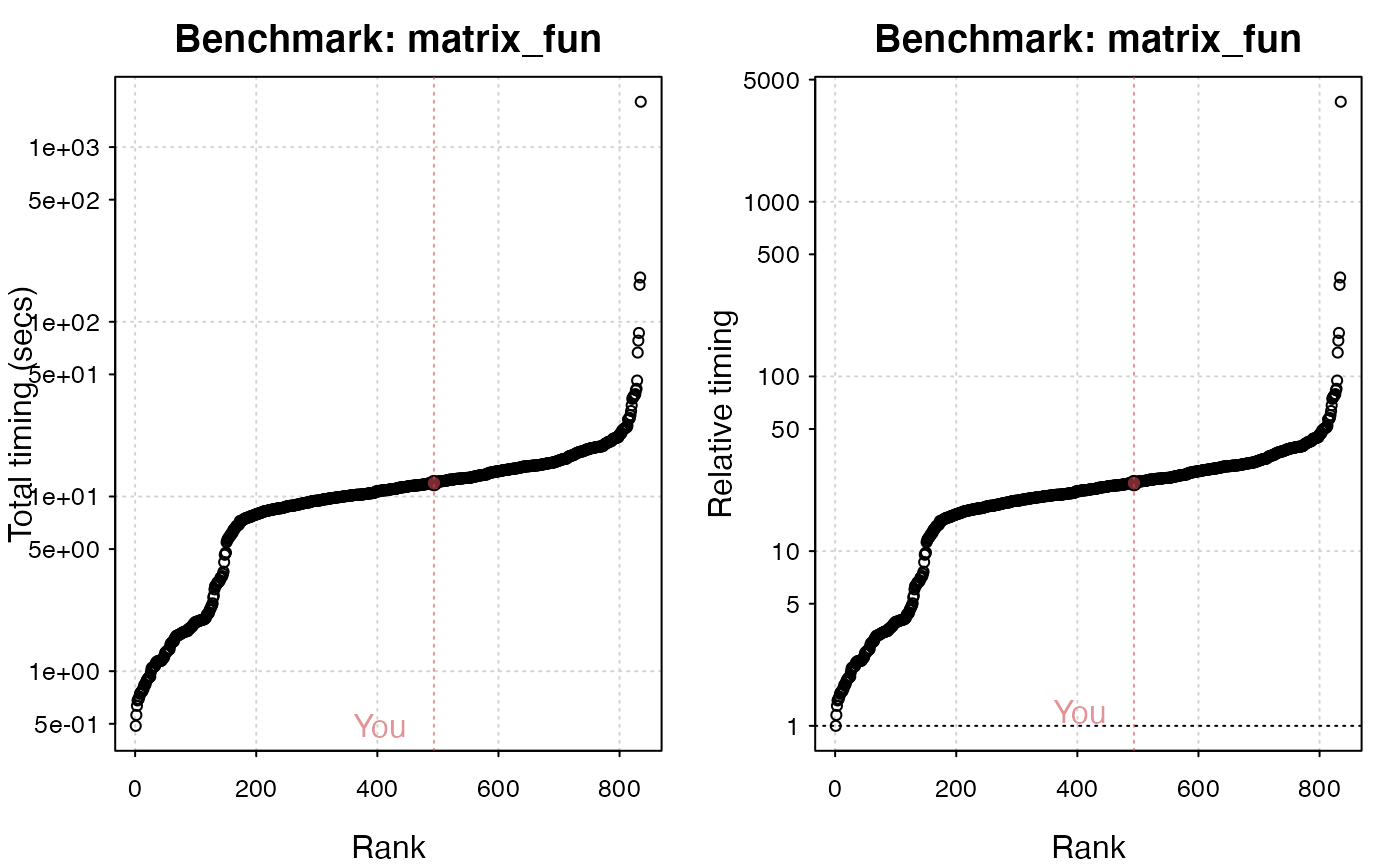
plot(
  x,
  test_group = unique(x$test_group),
  blas_optimize = is_blas_optimize(x),
  log = "y",
  ...
)
Arguments
- x
The output from a
benchmark_*call.- test_group
Default
unique(x$test_group). The default behaviour is select the groups from your benchmark results.- blas_optimize
Logical. Default The default behaviour is to compare your results with results that use the same blas_optimize setting. To use all results, set to
NULL.- log
By default the y axis is plotted on the log scale. To change, set the the argument equal to the empty parameter string,
"".- ...
Arguments to be passed to other downstream methods.


